Have you ever wondered what goes into producing the Celestial Calendar for an issue Sky & Telescope? Conceptually, it’s simple: look at various sources of information, find out what’s going on in the sky in a given month, and write 2–3 pages about it. Easy! But it sure didn’t feel easy when I took over CelCal in 2017.
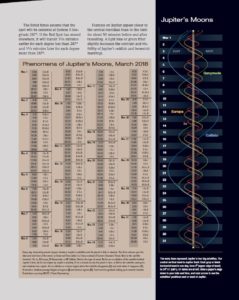
Actually, I’ve been responsible for several parts of CelCal since 2014. Once a year, I retrieve predictions for the Phenomena of Jupiter’s Moons from IMCCE. Each month, I take the relevant section and format it for the magazine and website. I also run all the Algol predictions as well as the Great Red Spot predictions for the magazine, using proprietary software developed by Roger Sinnott (our online tools were designed mostly by Adrian Ashford).
New to me in 2017 was writing the “Action at Jupiter” section (though it’s an easy task, since I pay a lot of attention to Jupiter anyway). I knock that out in much less than an hour. Being responsible for the Jupiter’s Moons “wigglegram” was also new to me. Roger still produces the wigglegram each month and submits it to our design department. After they are done with it, I proof it and okay it for the magazine.
So, that covers about 1 to 1-1/2 pages of CelCal. I fill the other 3 (sometimes 4, as we don’t run Algol predictions in the summer, and we don’t run Jupiter info when Jupiter is in conjunction with the Sun) with whatever I think best fits the month.
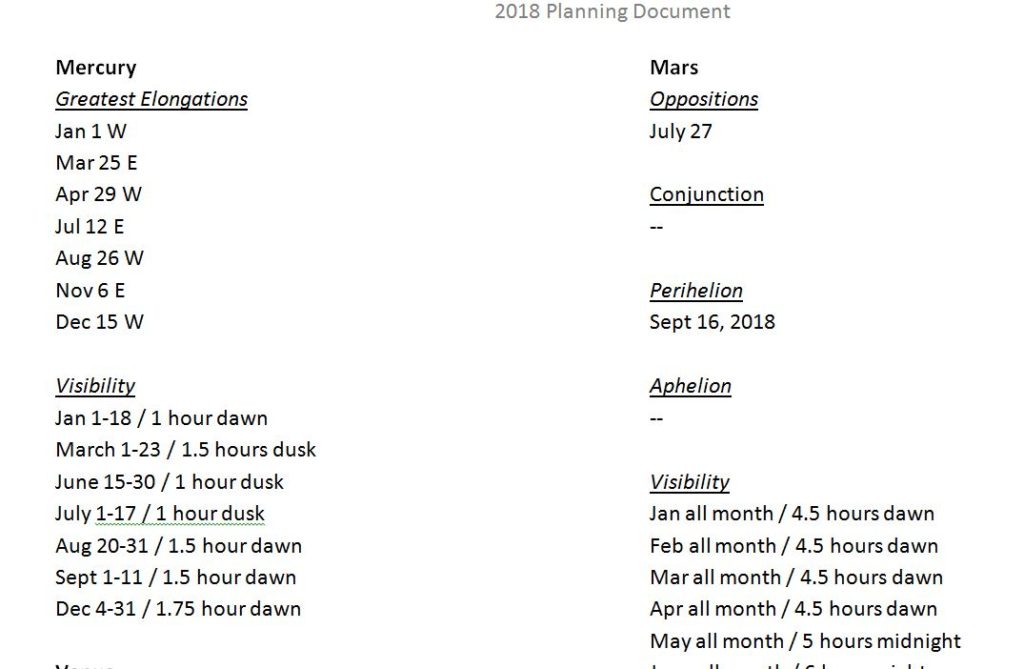
I use both a paper and computer file system for planning. The computer files mostly hold data I’ve collected to create our annual Observing Calendar. I do that work more than a year ahead (for instance, it’s January 2019 as I write this, but I finished the data for the 2020 calendar a month ago), so I always have a lot data on hand, well in advance.
My paper system includes a manila folder each month. I sort the hard copies of anything I used for the Observing Calendar into them: photocopies from the Astronomical Almanac and Sun, Moon and Planets (Meeus), printouts of maps and predictions for lunar and solar eclipses, early comet predictions, hard copies of meteor shower data from IMO, preliminary lists of asteroid/lunar occultations (I use Occult v.4.x to check final predictions), and so on, into the appropriate folders. I print sheets from our in-house planet visibility program. Ditto for meteor showers. Everything is heavily marked up (usually with green highlighter), because by the time I use the pages to write CelCal, I’ve already used them for the Observing Calendar and for SkyWatch.
I always have Meeus, the Astronomical Almanac, and the RASC Observer’s Handbook on my desk. I keep whatever random almanacs I have close by, too, just in case. I have an extensive library of atlases, reference books, history books, back issues, etc. in my own office, plus I can use whatever book I find in another editor’s office or in our main office bookshelves. I use a few different planetarium programs, such as TheSkyX and Stellarium. It’s hard to list all the websites I use for data. My favorite for checking things like sunrise, sunset, Moon phase, etc., is the USNO site, but of course I use a lot of NASA data (thank you HORIZONS web interface!). I think the main point is: I never trust one answer, no matter how reliable the source. For instance, I’m working the upcoming Pallas opposition right now, and normally I would trust Meeus, but HORIZONS gives me a different opposition date. How to resolve? In this case, I asked two other editors to run the data, and they came up with the same thing I did (agrees with HORIZONS). Then we asked one of our contacts at NASA to double-check our answers.
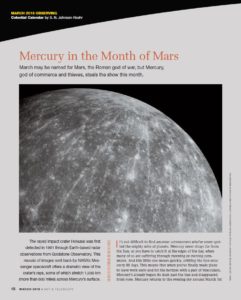
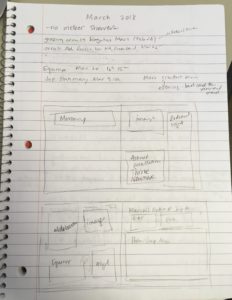
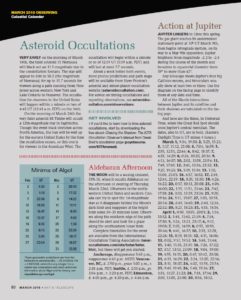
Although it’s the art department that ultimately decides the layout of each page, I like to do a small mock up before I start writing, just to see how I think things will fit. It’s very low tech. The spread for March 2018 at the top of this post first looked like this is my notebook.
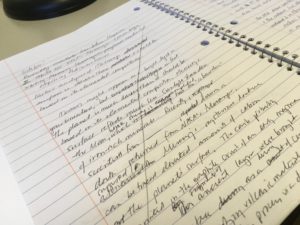
I have a spiral notebook I use to work out basic ideas. I scribble a bunch of random notes in it, maybe form a paragraph or two, then go back to my computer to write a first draft. The notebook also has about 10 pages dedicated to “stuff about meteor showers that doesn’t really change,” so I have to keep it around even though it’s almost full. My best guess is that it takes 18 months of CelCal and one issue of SkyWatch to fill a notebook.
I usually plan for the main story to take two pages. Although the March 2018 CelCal didn’t require a finder chart, if I’d been writing about a comet or an asteroid opposition, I would have needed one. I draw charts with an in-house program, then work with our design department to bring them into our house style/make them more useful. It usually takes me a few hours (creating, proofing, submitting to design, proofing the version finished by design) to make a chart. The typical opening CelCal spread has text, an image (or two), and a finder chart. I got to write a Mercury sidebar for March 2018 to fill the space where a chart would have been placed.
The second 2-page spread of CelCal is where I put things like occultations, major meteor showers that will be Mooned-out, etc. I can write about these in shorter paragraphs, so I can sometimes fit three topics in, depending on whether Algol predictions run or I need to write a lot about Jupiter.
After I get all the text written, I compile it into one document and format it to meet our house styles. This includes coming up with titles, subtitles, run-heads, captions, captions ledes, table headings, and so on. I select the images and charts that I want to run with the column as I go. Images need to get art-department approval, so I’m required to run my choices by them early in case I need to find something else. Once I have everything in a complete state, I give it all over to our Observing Editor. She double-checks everything I’ve written, right down to the extra blank space I tend to leave at the end of my paragraphs (you never know, that blank space might mess up the formatting of a paragraph one day). After she makes corrections, I go through the document again to see if I agree with the changes she’s made (usually I do, but not always. It makes me feel good to press “REJECT” every once in awhile).
After we come to an editorial consensus, which can take a bit of back and forth, I submit the full text and images to the art department. The art department does the layout as they see fit, trying to strike a balance between “communicates clearly” and “looks great.” Sometimes surprises happen at this point — an image doesn’t work after all, I messed up something on a chart, my text is too long, my text is too short, I wrote “standard time” instead of “daylight-saving time” — but usually the surprises are small and everything can move forward. I proof the proposed layout, then send it back to the art department. They finalize the layout, and send it to the Editor in Chief. He proofs the final layout. I proof it again. And then it all goes back to the art department for final production packaging. The entire magazine is sent to production at some point (not my job!), and soon after that, the digital files come back to our office for a final check by the Editor in Chief and Art Director before printing.
A lot of people work on those four pages! Editorially, I’m pretty independent. I’m best situated to know what’s “important” in the sky in any given month, so I choose the topics I’ll cover as I see fit. But in the end, many people collaborate to finish the pages — two editors (minimum), the design department, the art department, the Editor in Chief — so I can’t take the credit even if my name is at the top of the page.
